| Understanding crustal flow in the SW USA:
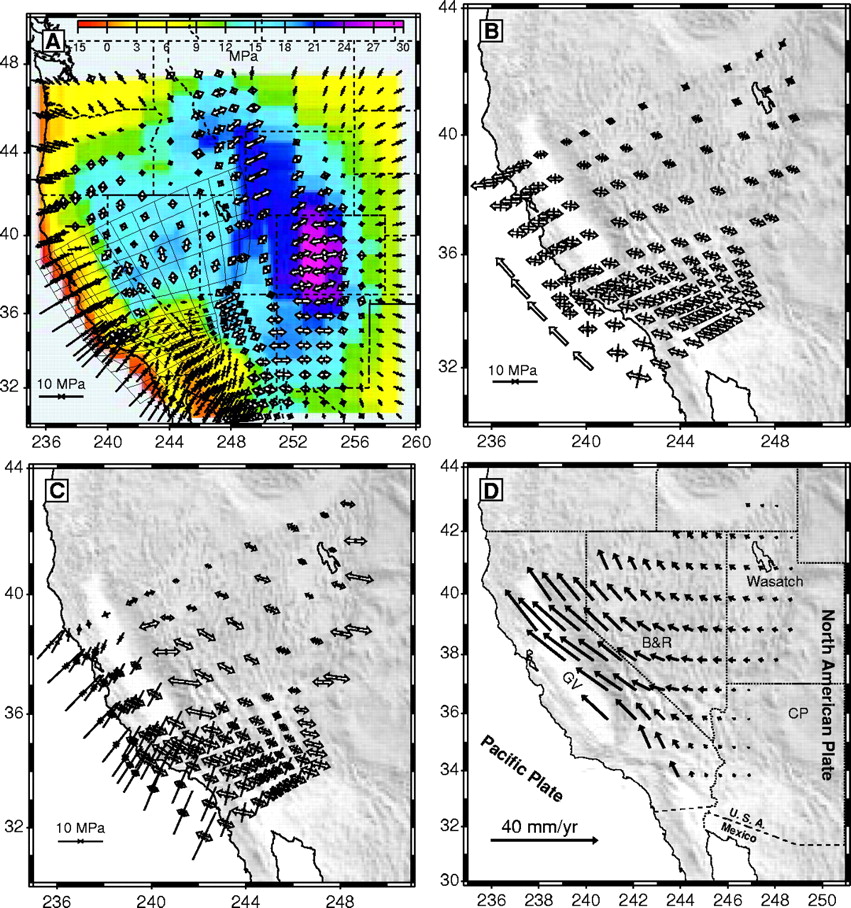
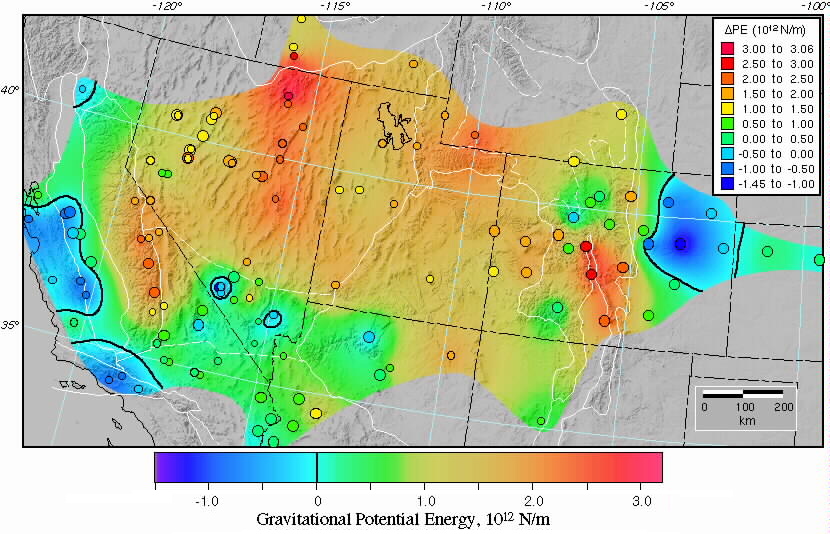
• (A) Deviatoric stress field determined from GPE variations, calculated assuming Airy compensation of topography. Different colors represent Δ GPE relative to a column of lithosphere at sea level. Tensional stress is shown as open white arrows and compressional stress is shown as black arrows.
• (B) Stress field boundary conditions. The analog motion (open arrows) associated with these boundary conditions has a PA-NA pole that is ~10º west of NUVEL-1A PA-NA pole.
• (C) The total vertically averaged (over L=100km) deviatoric stress field, that is, the sum of stresses due to potential energy variations (A) and plate interaction (B).
• (D) The self-consistent flow field determined from strain rates calculated by scaling the total stress tensor field (C) by the inverse of viscosity (see next slide) for all areas east of the San Andreas fault. Flesch et al., 2000, Science, 287.
|