|
|
|
Strain and Strain Analysis |
|
|
| The Fry Method |
|
|
|
After deformation the distance between two particles aligned with λ1 increases whereas two particles aligned in the direction of λ3 got closer. If strain is homogeneous, the sphere is transformed into an ellipsoid.
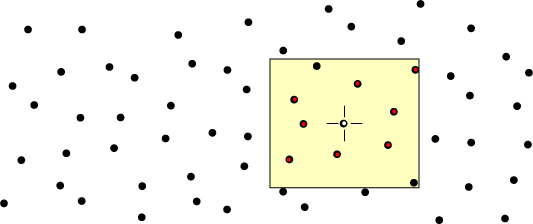
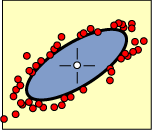
To determine the three axes of this ellipsoid structural geologists work successively on two perpendicular sections (thin sections, saw cuts through hand specimens, photographs) containing two of the three principal strain axes. The distance between a given particle (cross-hair below) and its neighbouring particles is plotted on a piece of tracing paper. The tracing paper and the cross is displaced successively over as many particles as possible and their closer neighbours are plotted. The sketches below show on the left a 2D section through a deformed rock. At first glance the particles seem to be randomly distributed. The Fry analysis reveals that in reality that sample has been deformed quite significantly since the neighbouring particles are distributed around an ellipse. The ratio long axis over short axis is a measure of the strain intensity. Plotting on a Flinn diagram the results obtained on two perpendicular sections each containing two of the three principal axes one can fully characterise the 3D finite strain ellipsoid. |
|
|
|
 |
|
|
 |
|
|
|
|
|
|
|
|
|
|
|
|